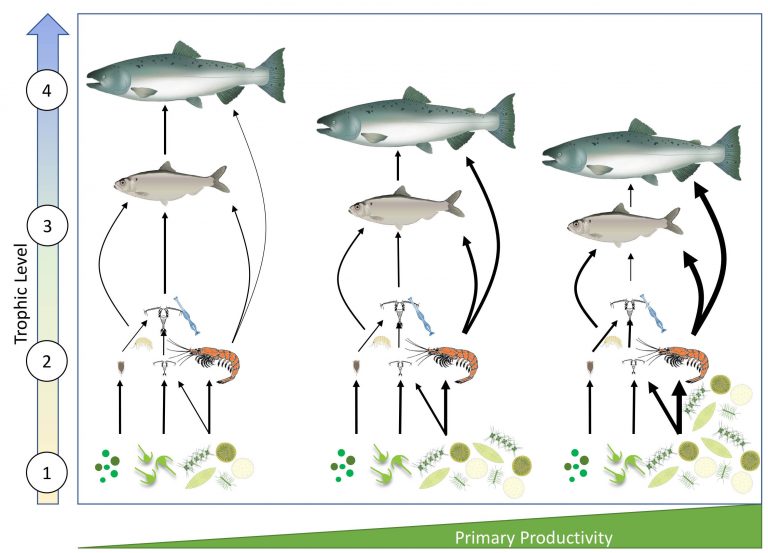
 At first glance, the food web of the pelagic marine environment of southern British Columbia appears straightforward: energy moves through a discrete set of trophic steps: phytoplankton blooms and is consumed by zooplankton, zooplankton in turn are eaten by small fish like herring, and small fish are eaten by larger fish like Chinook salmon. Food chain length, the number of trophic steps in a food web, as well as the position of an organism in a food chain, its trophic position, can seem invariable.
“Food chain length and trophic position are critical components of an ecosystem,” said Jacob Lerner, a PhD candidate in the Pelagic Ecosystems Lab, located in the Institute for the Oceans and Fisheries at the University of British Columbia. “These two variables determine ecosystem connectivity, levels of contaminant accumulation in higher predators, and the amount of energy transferred through the system.”
Until now, our understanding of what drives these variables in marine systems has been limited. As the same species exist throughout coastal British Columbia, it was presumed there are no regional differences in food web structure. However, there has been a growing body of evidence that this not being the case. “As we have learned more about the water conditions and plankton communities at the base of the food web in the coastal waters of British Columbia it has become clear that there are major regional differences,” said Dr. Brian Hunt, the project’s principal investigator and associate professor in UBC’s the Institute for the Oceans and Fisheries. “We became curious as to whether this translated into differences relevant to animals higher up the food chain.”
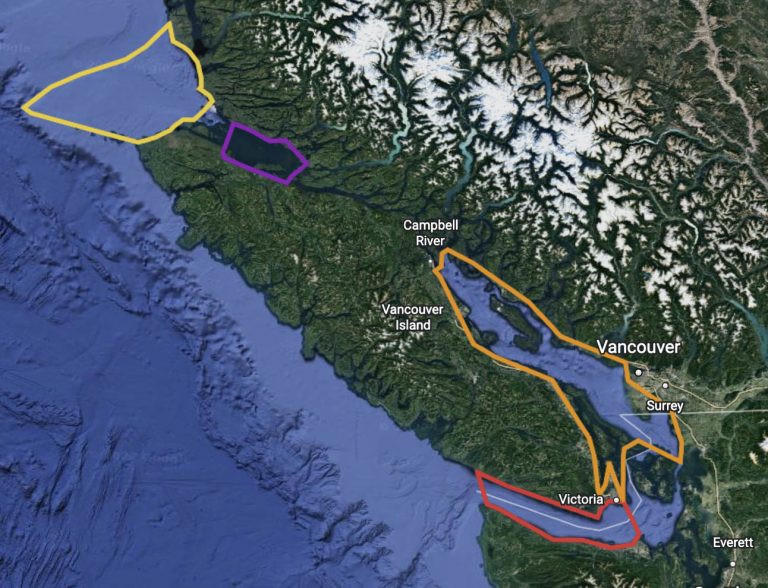
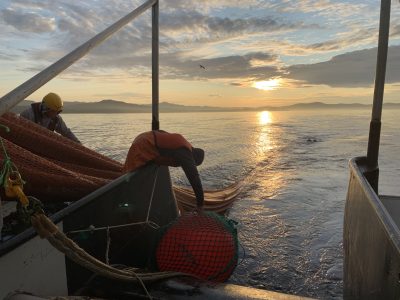
 In 2019, Lerner and Hunt set out to test this idea. With a small team, they embarked on a voyage on the F/V Seacrest to sample four oceanographically distinct regions of the BC coast: the Strait of Juan de Fuca, the Strait of Georgia, Queen Charlotte Strait, and Queen Charlotte Sound. Samples were collected from organisms across the entire food web, from phytoplankton to large piscivorous salmon using a range of different sampling gears, from plankton to trawl nets.
The samples were taken back to the lab to measure their chemical properties, specifically their nitrogen stable isotope values, a naturally occurring chemical tracer of food web structure. Nitrogen stable isotope values in an organism’s tissue correlate with its trophic position in the marine food web; the greater the nitrogen isotope values, the higher the trophic position. The researchers were able to determine an organism’s trophic level and, by determining the difference between the species with the lowest and highest trophic levels in a particular region, the region’s food chain length.
“Immediately we saw an interesting trend,” said Lerner. “Rather than identical food webs across regions, we found clear differences in food chain length between regions and these differences were mirrored in shifts in species trophic level.” Pacific hake, for example, had a trophic level of 4 in Juan de Fuca, the region with the longest food chain, implying a diet heavy in fish; yet, in the Strait of Georgia, the region with the shortest food chain, hake had a trophic level of 3.4 implying a more omnivorous diet with greater amounts of zooplankton. “We initially didn’t know what was causing it,” Lerner added.
Typical suspects known to affect food web structure, such as climate variability and species composition, were not a factor in the small geographic space of the survey area, compelling the researchers to consider another potential driver: regional differences in levels of phytoplankton biomass, often measured by levels of chlorophyll. Unfortunately, with just a few days of in-situ chlorophyll measurements for each region in the survey, the original analysis lacked enough data to explore this variable.
 A breakthrough came when the researchers, with help from one of the lab’s postdoctoral fellows, Christian Marchese, analyzed high resolution satellite chlorophyll data from the coast. These data showed that although diatoms, the biggest phytoplankton, dominated biomass in all the areas sampled, the total biomass differed between the four regions. It was discovered that food chains were shorter and species trophic level lower in the regions with the highest phytoplankton biomass and correspondingly, the highest levels of diatoms.
Diatoms are good food for the largest zooplankton grazers – krill. These shrimp-like crustaceans are big enough to be eaten by even the highest trophic levels. In areas with large krill biomass, like the Strait of Georgia, the higher trophic level species such as Chinook salmon feed on a higher proportion of krill than fish and this causes food chain length and species’ trophic position to decrease—a model termed ‘bottom-up omnivory’.
Shifts in phytoplankton size structure, from small picooplankton to large diatoms, is usually thought to be the main factor determining food web structure in global marine ecosystems, with the biggest distinction being made between low nutrient tropical waters and nutrient replete temperate waters like coastal British Columbia. “We provided evidence for bottom-up omnivory in nutrient-rich temperate pelagic ecosystems, where food chain length is determined by the level of diatom production,” said Lerner. “This is very different from the global model for pelagic ecosystems.”
As these eutrophic coastal ecosystems support some of the BC’s, and the world’s, most important fisheries, improving our understanding of how they work will help us model ecosystems and predict the impact of human caused disturbances like climate change.
Stable isotopes reveal that bottom-up omnivory drives food chain length and trophic position in eutrophic coastal ecosystems, was published in ICES Journal of Marine Science.
Tags: biology, Brian Hunt, British Columbia, faculty, fish, food webs, IOF students, krill, Pelagic Ecosystems Lab, plankton, Research, salmon, zooplankton